
Time Series - Ensembles#
A TimeSeriesEnsemble holds many realizations of the same series: the same variable, at the same site, over the same time. Typical examples are model runs with perturbed inputs or parameters, or draws of a stochastic generator. Unlike a TimeSeriesCluster, where each series is a different site, the members of an ensemble are interchangeable: what matters is how they spread at each time step.
Covered here:
Assembling an ensemble
Reducers: statistics across members at each time step
Custom reducers
Visuals, with reducers and percentile bands highlighted over the members
See also
Check out the Time Series - Clusters tutorial first.
Notebook setup#
For users running this tutorial as a Jupyter Notebook, this cell must be executed first:
import sys
from pathlib import Path
import numpy as np
import pandas as pd

# Install `plans` in `google.colab`.
# Use `pip install plans` for other environments.

if "google.colab" in sys.modules:
    import os
    os.system(f"{sys.executable} -m pip install -q plans")

from plans.datasets import TemperatureSeries, TimeSeriesEnsemble

# This avoids warnings related to uninstalled fonts
import logging
logging.getLogger('matplotlib.font_manager').setLevel(logging.ERROR)

rng = np.random.default_rng(seed=5)  # ensure reproducibility
Build a synthetic ensemble#
Fifty members of daily temperature over one year. Each member shares the cycle, but has its own bias and its own weather (an autoregressive anomaly), like runs of a model with uncertain inputs. Members are assembled in memory with .set_data() and .append():
n_members = 50
n = 365
t = np.arange(n)
dates = pd.date_range(start="2021-01-01", periods=n, freq="D")
cycle = 18 + 5 * np.sin(2 * np.pi * (t - 100) / 365)

def make_anomaly(phi, sd):
    # autoregressive anomaly: a[t] = phi * a[t-1] + shock
    a = np.zeros(n)
    e = rng.normal(loc=0, scale=sd, size=n)
    for i in range(1, n):
        a[i] = phi * a[i - 1] + e[i]
    return a

tse = TimeSeriesEnsemble(name="Projections", base_object=TemperatureSeries)
for k in range(n_members):
    bias = rng.normal(loc=0, scale=0.8)
    values = cycle + bias + make_anomaly(phi=0.85, sd=1.2)
    name = f"R{k + 1:02d}"
    ts = TemperatureSeries(name=name, alias=name)
    ts.set_data(
        input_df=pd.DataFrame({"datetime": dates, "T": values}),
        input_dtfield="datetime",
        input_varfield="T",
    )
    tse.append(new_object=ts)

tse.update(details=True)
print(f"Members: {len(tse.catalog)}")
Members: 50
Reducers#
Reducers compute a statistic across all members at each time step, returning a pandas.DataFrame with the datetime and one column per statistic, named {varalias}_{statistic}. The ensemble mean:
tse.mean().head()
| datetime | TAS_mean | |
|---|---|---|
| 0 | 2021-01-01 | 12.980556 |
| 1 | 2021-01-02 | 13.090094 |
| 2 | 2021-01-03 | 13.339110 |
| 3 | 2021-01-04 | 13.175806 |
| 4 | 2021-01-05 | 13.262177 |
Other shortcuts follow the same pattern: .median(), .min(), .max(), .std() and .rng() (range, max minus min). For instance, the spread of the members at each time step:
df = pd.merge(left=tse.std(), right=tse.rng(), on="datetime")
df.describe().round(2)
| datetime | TAS_std | TAS_rng | |
|---|---|---|---|
| count | 365 | 365.00 | 365.00 |
| mean | 2021-07-02 00:00:00 | 2.38 | 10.70 |
| min | 2021-01-01 00:00:00 | 0.83 | 3.69 |
| 25% | 2021-04-02 00:00:00 | 2.22 | 9.64 |
| 50% | 2021-07-02 00:00:00 | 2.37 | 10.53 |
| 75% | 2021-10-01 00:00:00 | 2.53 | 11.69 |
| max | 2021-12-31 00:00:00 | 3.05 | 15.11 |
| std | NaN | 0.25 | 1.62 |
Percentiles are named by their value, zero padded for single digits:
tse.percentiles(values=[5, 50, 95]).head()
| datetime | TAS_p05 | TAS_p50 | TAS_p95 | |
|---|---|---|---|---|
| 0 | 2021-01-01 | 11.693718 | 13.015260 | 14.442660 |
| 1 | 2021-01-02 | 10.666103 | 13.132855 | 15.363180 |
| 2 | 2021-01-03 | 10.850595 | 13.187258 | 16.303278 |
| 3 | 2021-01-04 | 10.204379 | 13.073605 | 16.965536 |
| 4 | 2021-01-05 | 9.807915 | 13.233080 | 16.525497 |
Use .stats() for a combined table, with basic=True to keep only the quartiles:
tse.stats(basic=True).head()
| datetime | TAS_sum | TAS_mean | TAS_std | TAS_min | TAS_max | TAS_p25 | TAS_p50 | TAS_p75 | |
|---|---|---|---|---|---|---|---|---|---|
| 0 | 2021-01-01 | 649.027782 | 12.980556 | 0.831914 | 11.021421 | 14.712603 | 12.383723 | 13.015260 | 13.448634 |
| 1 | 2021-01-02 | 654.504715 | 13.090094 | 1.397770 | 9.769784 | 15.754714 | 12.176977 | 13.132855 | 13.946630 |
| 2 | 2021-01-03 | 666.955508 | 13.339110 | 1.658178 | 9.517009 | 16.505162 | 12.006084 | 13.187258 | 14.604220 |
| 3 | 2021-01-04 | 658.790304 | 13.175806 | 2.063791 | 9.095344 | 17.591517 | 11.706462 | 13.073605 | 14.393864 |
| 4 | 2021-01-05 | 663.108836 | 13.262177 | 2.024634 | 9.098102 | 17.900176 | 11.761767 | 13.233080 | 14.552708 |
Note
Reducers ignore missing values, so members with gaps or shorter records still contribute where they have data.
Custom reducers#
The .reducer() method takes any function that reduces along an axis. Each entry maps an output name to a function (Func) and an optional extra argument (Args). For instance, the fraction of members above 25 C at each time step reads as the probability of a hot day. The five most likely hot days:
def fraction_above_25(x, axis):
    return np.nanmean(x > 25, axis=axis)

df_hot = tse.reducer(
    reducer_funcs={"hot": {"Func": fraction_above_25, "Args": None}}
)
df_hot.nlargest(5, "TAS_hot")
| datetime | TAS_hot | |
|---|---|---|
| 177 | 2021-06-27 | 0.26 |
| 195 | 2021-07-15 | 0.26 |
| 210 | 2021-07-30 | 0.26 |
| 214 | 2021-08-03 | 0.26 |
| 216 | 2021-08-05 | 0.26 |
Reducers as series#
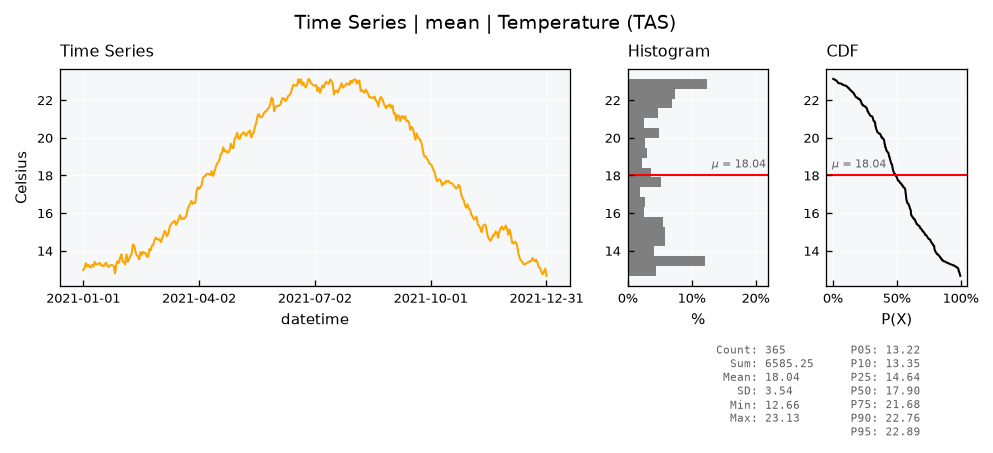
To use a reducer as a regular series, get it with .get_reducer_series(). It returns an object of the ensemble base type (here a TemperatureSeries), so all its methods are available:
ts_mean = tse.get_reducer_series(name="mean")
print(type(ts_mean))
ts_mean.view()
<class 'plans.datasets.chrono.TemperatureSeries'>
Visualizations#
The default view of an ensemble draws the members in a light background style, and highlights on top the reducers listed in view_specs["reducers"] (the mean, by default) and the percentile bands in view_specs["bands"] (5 to 95, by default):
tse.view()
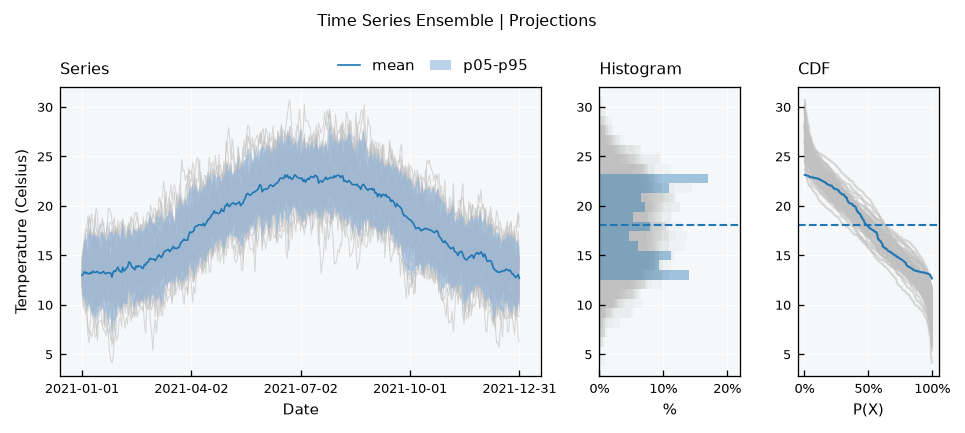
Note how narrow the histogram and the CDF of the mean are, compared to any member. Averaging cancels out the weather of individual members, so the ensemble mean is a summary of the ensemble, not a realistic realization: it has far fewer warm and cold extremes than any member.
Choosing reducers and bands#
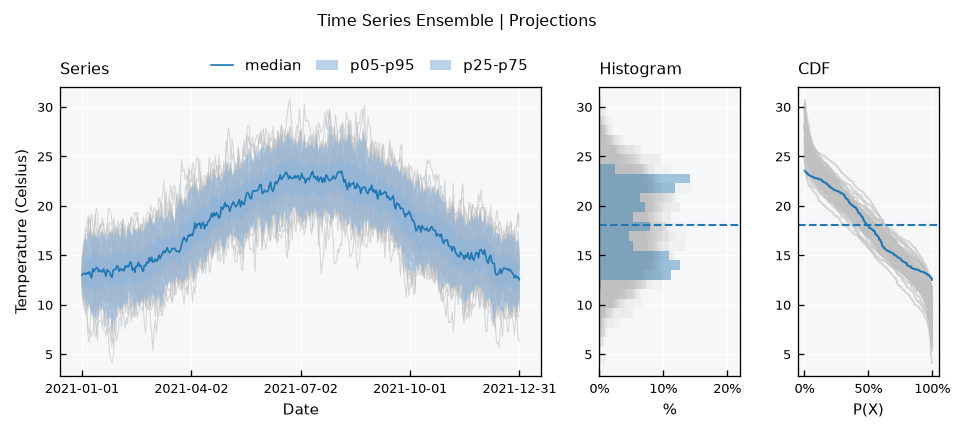
Reducers are given by name: mean, median, min, max or a percentile such as p90. Bands are given as [low, high] percentile pairs, and nest when more than one is given:
tse.view_specs["reducers"] = ["median"]
tse.view_specs["bands"] = [[5, 95], [25, 75]]
tse.view()
Highlighting members#
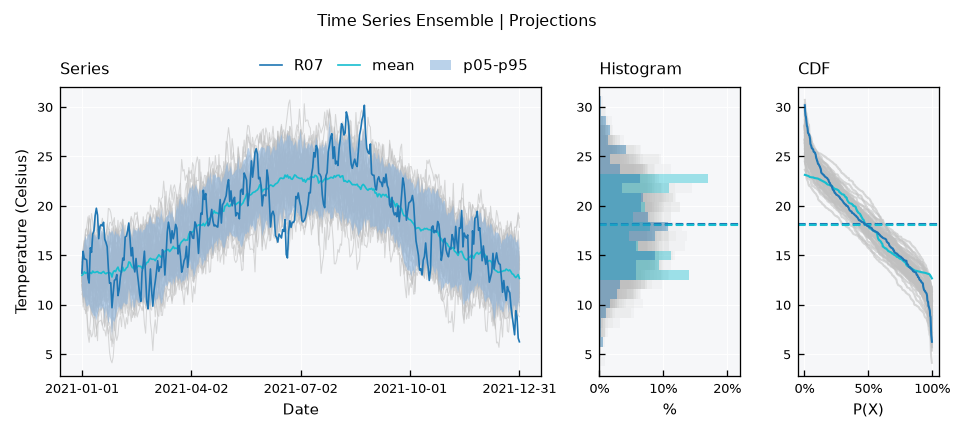
Like in a cluster, view_specs["highlight"] draws selected members in color. Compare a single member against the mean: the member is as variable as the background, while the mean is smooth:
tse.view_specs["reducers"] = ["mean"]
tse.view_specs["bands"] = [[5, 95]]
tse.view_specs["highlight"] = ["R07"]
tse.view()
For the series panel only, use the series-simple layout:
tse.view_specs["highlight"] = None
tse.view_specs["layout"] = "series-simple"
tse.view()
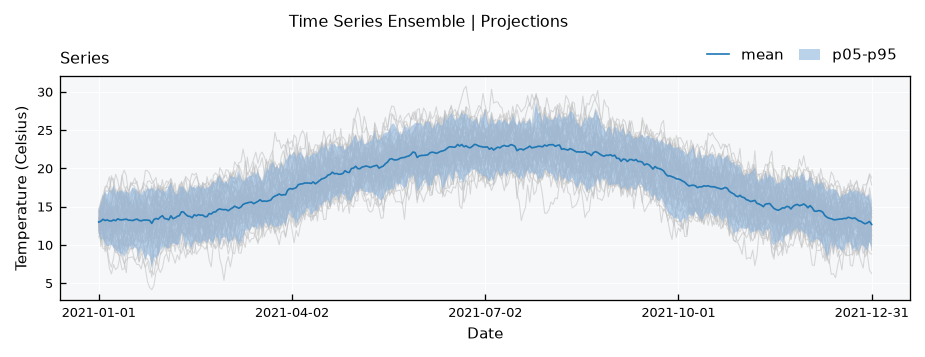
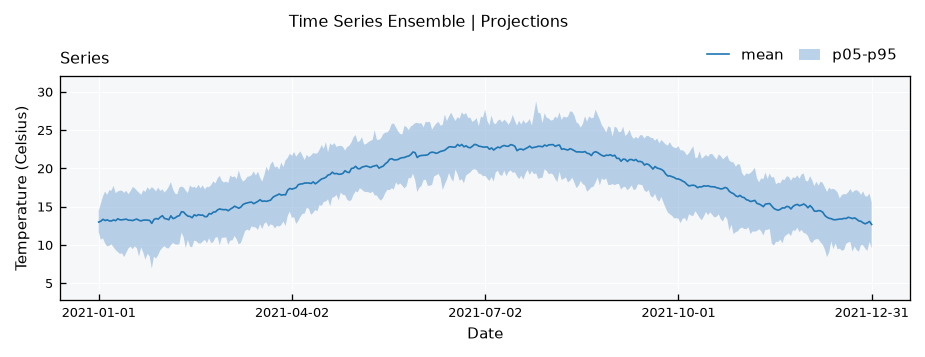
The background lines can clutter the panel, mainly with many members. Set view_specs["plot_background"] to False to hide them. This only affects the series panel, and highlighted members are still drawn:
tse.view_specs["plot_background"] = False
tse.view()
Recap#
A
TimeSeriesEnsembleholds realizations of the same series, assembled like any collection.Reducers (
.mean(),.percentiles(),.stats(), …) compute statistics across members at each time step, ignoring missing values;.reducer()takes custom functions..get_reducer_series()turns a reducer into a regular series.The default view highlights reducers and percentile bands over the members, set by
view_specs["reducers"]andview_specs["bands"].view_specs["plot_background"] = Falsehides the background lines of the series panel.