About#
The PEM Project (Planejamento Espacial Marinho do Brasil, or Marine Spatial Planning for Brazil) is a national initiative aimed at developing spatially explicit guidelines for the sustainable and strategic use of the Brazilian marine environment.
This page provides a conceptual overview of the general workflow, which forms the core of the PEM methodology and underpins all regional plans.
By following this structured and data-driven workflow, the PEM framework ensures reproducibility, transparency, and scientific robustness in the assessment of marine spatial planning outcomes.
All analytical steps are implemented through R and Python scripts, available in this repository, which can be adapted for different regions and data resolutions.
See also
For implementation details see the User Guide
PEM framework#
The PEM framework represents the most abstract and reproducible component of the PEM method.
It begins at a zero level of information, where only spatial data are available, and transforms these datasets into spatially explicit indicators and decision-support maps.
Input Data#
At the foundation level, the workflow integrates diverse spatial datasets, including:
Bathymetry – ocean depth and seabed morphology.
Habitats – distribution and characteristics of marine environments that provide ecosystem services.
Users – spatial footprint of human activities across sectors such as fisheries, energy and transportation.
Land Hubs – ports, cities, and infrastructure nodes in land that receives direct economic benefits from activities in the ocean.
Coastal features - other important geographical features of the coastline that influence the definition of management units.
These datasets serve as the basis for constructing higher-level spatial information layers.
The Spatial Model#
PEM framework use a spatial model that allows comprehensive decision-making.
This model represents the ocean space and adjacent land as a two-dimensional surface divided into model cells. Each model cell describes the spatial unit of analysis, allowing the integration of land, coastline, and marine environments within the same planning structure.
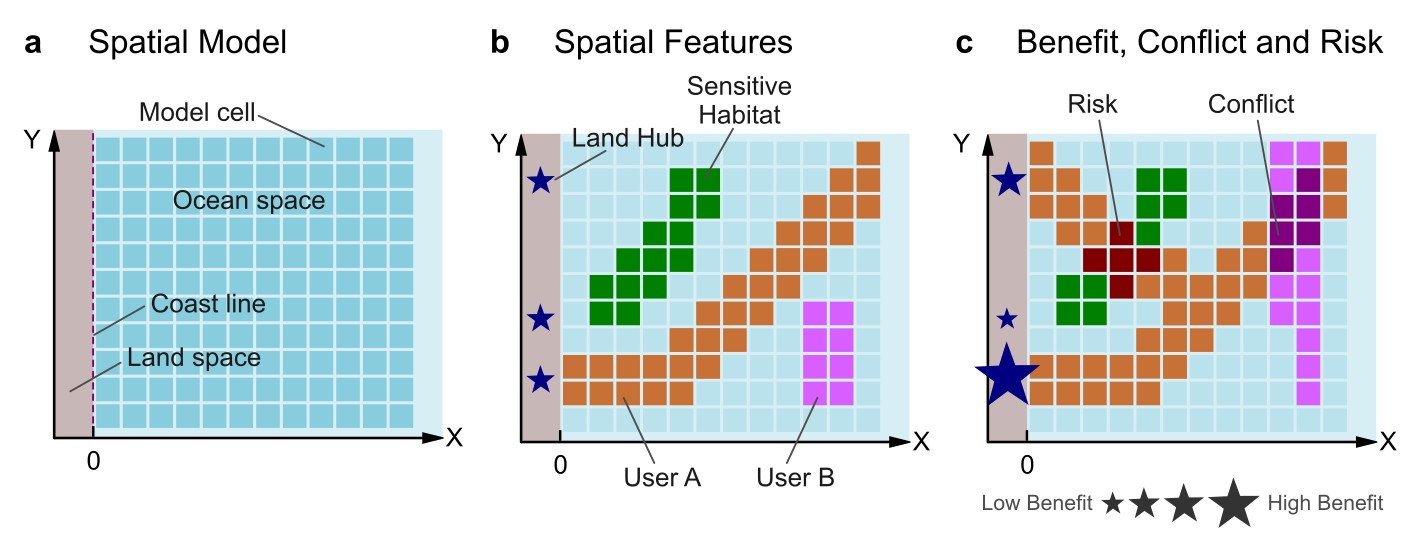
Conceptual representation of the spatial model in the PEM framework. The ocean and land areas are divided into a spatial grid, where land hubs, habitats, and users interact to generate benefit, risk, and conflict metrics that support integrated performance assessment and scenario simulation.#
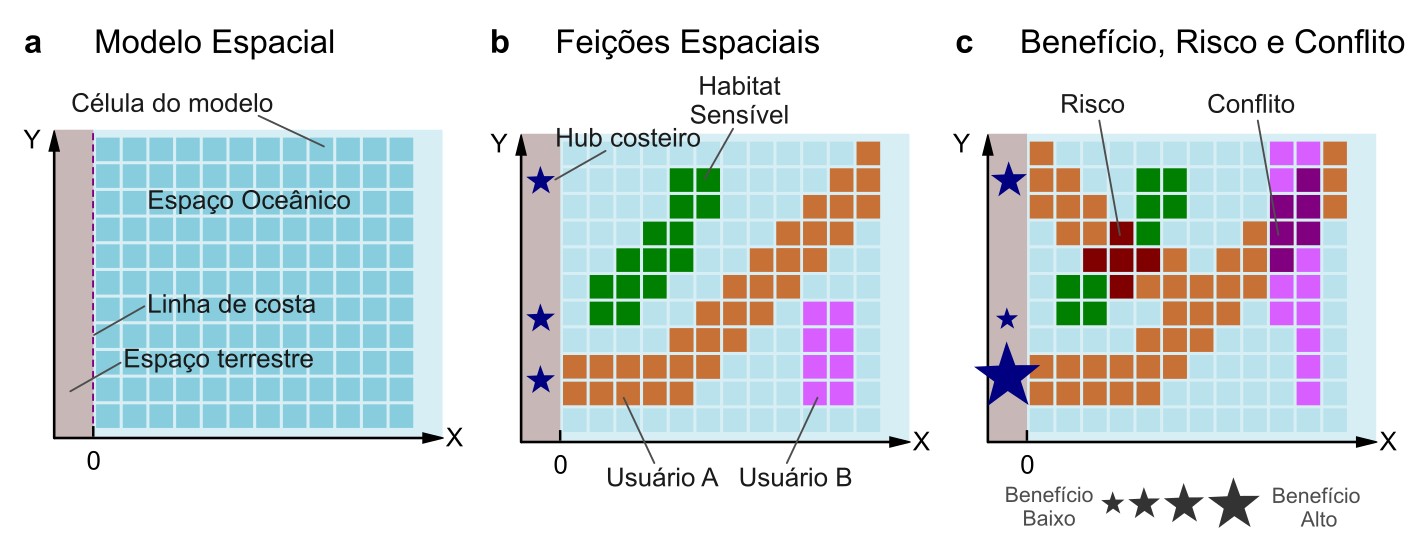
Representação conceitual do modelo espacial no arcabouço PEM. As áreas oceânicas e terrestres são divididas em uma grade espacial, onde os Hubs costeiros, Habitats e usuários interagem para gerar métricas de benefício, risco e conflito que apoiam avaliação integrada de desempenho e simulação de cenários.#
Within this space, several spatial features are represented: Land Hubs such as ports and coastal cities; Habitats, which are sources of ecosystem services and may be sensitive to disturbance; and ocean Users, representing the various economic sectors that occupy and use ecosystem services.
These elements coexist and interact across the ocean space grid, forming the physical and functional components of the system.
The dynamic interaction among these components gives rise to three key dimensions of spatial performance: Benefit, Risk, and Conflict.
Benefits flow from users through the use of ecosystem services and connect back to land hubs. Risks emerge where users overlap with sensitive habitats, and conflicts arise where different users compete for the same space.
Together, these dimensions define the integrative structure of the PEM framework, which supports both diagnostic evaluation and scenario-based simulation of marine use performance.
Scenario-Based Analyses#
All spatial indexes (\(B\), \(R\), and \(C\)) are computed for specific use Scenarios of the ocean space.
Scenarios may represent current conditions, projected developments, or management alternatives, allowing \(D\) to serve as a comparative tool for evaluating policy or spatial planning options.
Examples of a typical scenario setting in the PEM framework:
baselinescenario, representing the observed conditions until the present moment.business-as-usualscenario, representing the projected future if no extra management or planning if taken.eco-developmentscenario, representing a simulated future where biodiversity conservation heavily is enforced.
Management Units#
An important component of the PEM framework is the definition of Management Units, denoted as UPG — spatial zones that organize and guide marine management actions.
See also
Check out more information about the definition of Management Units
Use Performance Index#
The core integrative indicator of the PEM framework is the Marine Ecosystem Services Use Performance Index,
Note
In portuguese, this index is referred as Índice de Desempenho do Uso de Serviços Ecossistêmicos do Mar, or IDUSE-Mar for short.
This index, denoted as \(D\), synthesizes the three component dimensions — benefit, risk, and conflict — into a single expression of marine use performance:
Where:
\(D\) is the use performance index \(\in [0, +\infty]\);
\(B\) is the benefit index \(\in [0, 1]\);
\(R\) is the habitat risk index \(\in [0, 1]\); and
\(C\) is the conflict index \(\in [0, 1]\).
The interpretation of \(D\) is straight-forward: it is as a correction for the economic benefit of using the ocean space by taking consideration risk and conflict as well.
The value of \(D\) must be maximized by ocean management policies, since it indicates a more sustainable and efficient use of the ocean space — high benefits with relatively low risk and conflict. A policy that solely maximizes benefit will more likely yield an inferior use performance than one that keeps risk and conflict low.
All component variables are spatially explicit, hence \(D\) is a local spatial variable too, being computed at every model cell. The value of \(D\) can then be upscaled by averaging for the scale of interest, like the Management Units.
Performance Hyperspace#
Because all components of \(D\) are normalized variables, i.e., defined between 0 and 1, the mathematical hyperspace of \(D\) can be explored a priori.
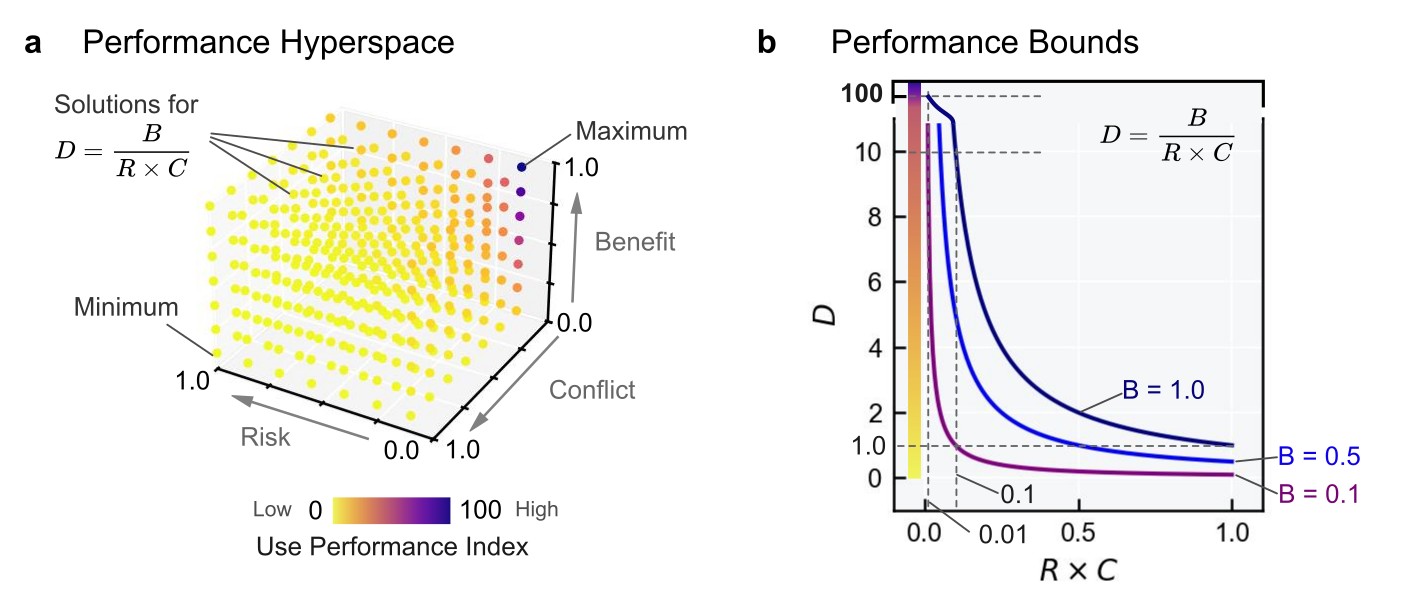
Exploration of the Use Performance Index formula. (a) The performance mathematical hyperspace. (b) Mathematical bounds for the performance index.#
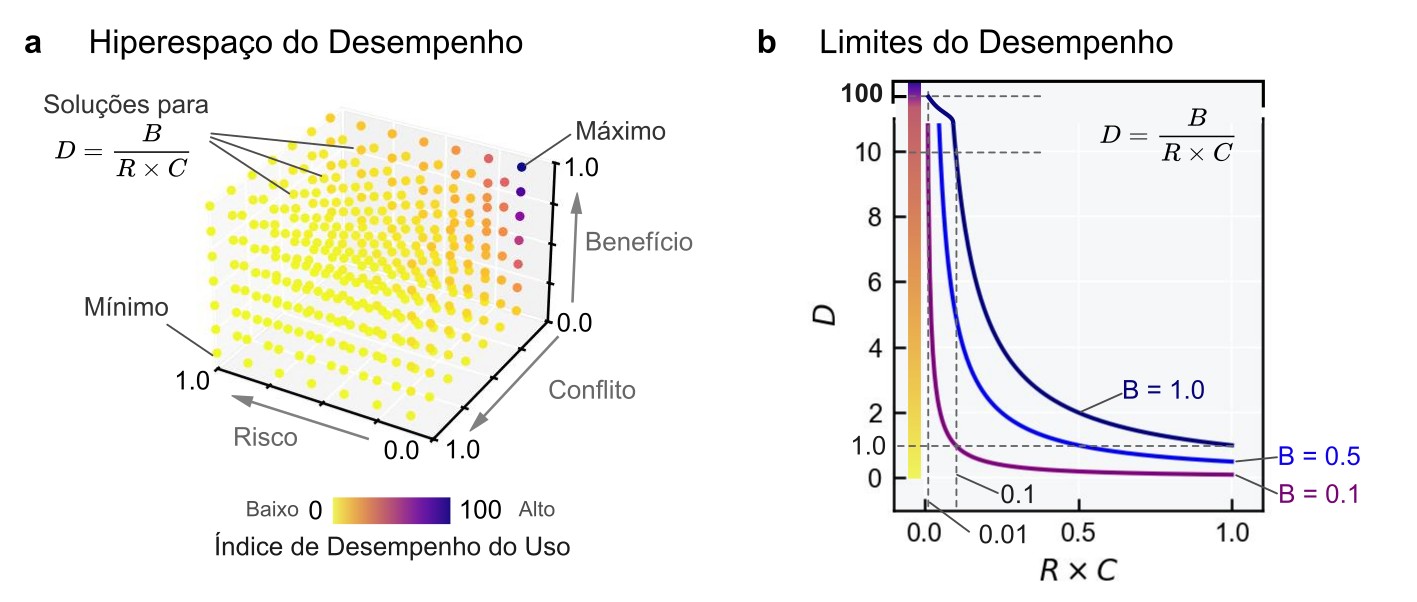
Exploração da fórmula do Índice de Desempenho. (a) O hiperespaço matemático de desempenho. (b) Limites matemáticos para o índice de desempenho.#
The upper value of \(D\) is unbounded, it goes to infinity. That means that values of \(D\) can skyrocket if the product \(R \times C\) goes very low, close to zero. To avoid technical issues with numerical overflow, one might truncate the value of the product \(R \times C\) to 0.01, which will yield an upper bound of 100.
The lower value of \(D\) is bounded to zero, and always converges to the value of \(B\). When the product \(R \times C\) goes to maximum possible, that is 1, The value of \(D\) converges to \(B\). This means that the correction for \(R\) and \(C\) are always incremental, making \(D\) larger than \(B\), like an incentive to lower \(R\) or \(C\).
Spatial Indexes#
To get \(D\) one need to compute all three subjacent spatial indexes: \(B\), \(R\) and \(C\).
The PEM framework is designed to help in this process. Through a series of converging analytical processes, the input data are transformed into this spatial index components.
See also
The Benefit Index quantifies the economic and social benefit derived from the use of every model cell in the ocean space.
Check out more about the in the Benefit Index page
See also
The Habitat Risk Index captures the sensitivity of marine habitats exposed to human activities, considered here as ecosystem stressors.
Check out more about in the Habitat Risk Index page
See also
The Conflict Index expresses the intensity of overlap or competition between different marine uses within the model cell.
Check out more about in the Conflict Index page